Findings 2012
Annual Report(Fiscal Year 2012)
- Theme 1 Simulations of biomolecules in cellular environments
- Theme 2 Simulation applicable to drug design
- Theme 3 Hierarchical integrated simulation for predictive medicine
- Theme 4 Large-scale analysis of life data
Simulations of biomolecules in cellular environments (Theme 1, Yuji Sugita, GL)
We predict protein-protein and protein-DNA interactions in realistic cellular environments, performing large-scale simulations of biomolecules on K computer. This project contains the following two subprojects: (i) investigating the effect of macromolecular crowding on enzyme reactions in EGF signal pathway and (ii) multi-scale modeling of nucleosomes and chromatin. In the first subproject, we performed atomistic molecular dynamics (MD) simulations of protein crowding systems with explicit solvents. In the crowding systems, diffusion of water slows down and dielectric constant of water becomes almost half compared to that of bulk water, suggesting that protein-protein interaction is enhanced in the crowing environment. As a next step, we are performing large-scale atomistic MD simulations of bacteria cytoplasm that contains more than 10 million or 100 million atoms for investigating protein-protein or protein-metabolite interactions in details. Based on the physical properties on the crowding environment, we study the effect of macromolecular crowding on enzymatic reactions in EGF signal pathway via multi-scale simulations and modeling. Single-particle simulations show the effect of macromolecular crowding on the response of MEK/ERK motif and coarse-grained(CG) MD simulation predict the MEK/ERK complex structure. QM/MM calculation is planned to examine dual phosphorylation of ERK in crowded environment. We integrate all the information from different simulations to understand crowding effects on the EGF pathway. In the second project, a new free-energy simulation method where atomistic MD simulations simulate multiple copies of a nucleosome in explicit solvent was established. On K computer, each MD simulation utilizes 48 nodes and hundred copies of a nucleosome are simulated simultaneously and almost independently. Using this method, conformational changes of different types of nucleosomes are compared to understand their biological functions. Not only atomistic MD simulations but also CGMD simulations are used to simulate conformational dynamics of a single nucleosome, a nucleosome dimer or trimer, or a chromatin. Since CGMD simulations can reduce the number of particles in a simulation system, slow conformational changes of biomolecules that are not accessed with atomistic MD simulations can be simulated only with CGMD. In both subprojects, close collaborations with experimentalists are planned. In the former subproject, we collaborate with NMR experimentalists or biochemists, whereas, in the latter, information from X-ray crystallography, SAXS (small angle X-ray scattering) or XFEL (X-ray free electron laser) is utilized for improving our MD simulations. Both subprojects need huge computational resources that are available only on K computer.
Simulation applicable to drug design(Theme 2, Hideaki Fujitani, GL)
MP-CAFEE uses GROMACS molecular dynamics package that has SIMD intrinsic accelerated kernels to calculate van der Waals and electrostatic interactions efficiently for popular CPU architectures. Collaborating with the GROMACS developer, we made intrinsic accelerated kernels for SPARC64 architecture of K computer. With new optimized kernels we can perform molecular dynamics simulations on K computer in double efficient way in comparison with the older GROMACS and other molecular dynamics programs. It seems we have two K computers by GROMACS.
We perform 384 molecular dynamics simulations with different parameters in order to calculate a binding free energy by MP-CAFEE. There are important requirements for accurate free energy calculations. The first requirement is a well-equilibrated bound structure including the conformational change of the protein induced by the binding of ligand. The second one is the convergence of the work distribution with a sufficient number of trajectories and dense spacing of the coupling constant between the ligand and the rest of the system. The last one is accurate force field.
Major urinary protein (MUP) has a unique binding structure (FIG. 1). It wraps the whole ligand so that the binding site cannot be seen from outside the protein. We calculated binding free energies of two MUP ligands: 2-methoxy-3-isopropylpyrazine (IPMP) and 2-methoxy-3-isobutylpyrazine (IBMP). With FUJI force field the calculated vales well agreed with experimental values measured by isothermal titration calorimetry (ITC) but with AMBER99SB-ILDN the calculated one deviates by about two kcal/mol from the experimental one (FIG. 2). This difference comes from the protein backbone force field. Because the binding site is embedded in the protein, the backbone motion is essential for the MUP ligand binding. The backbone torsion parameters of FUJI force field are derived to agree with the most accurate ab initio molecular orbital calculations by LCCSD(T0) (FIG. 3) so that it can accurately describe the protein motion.
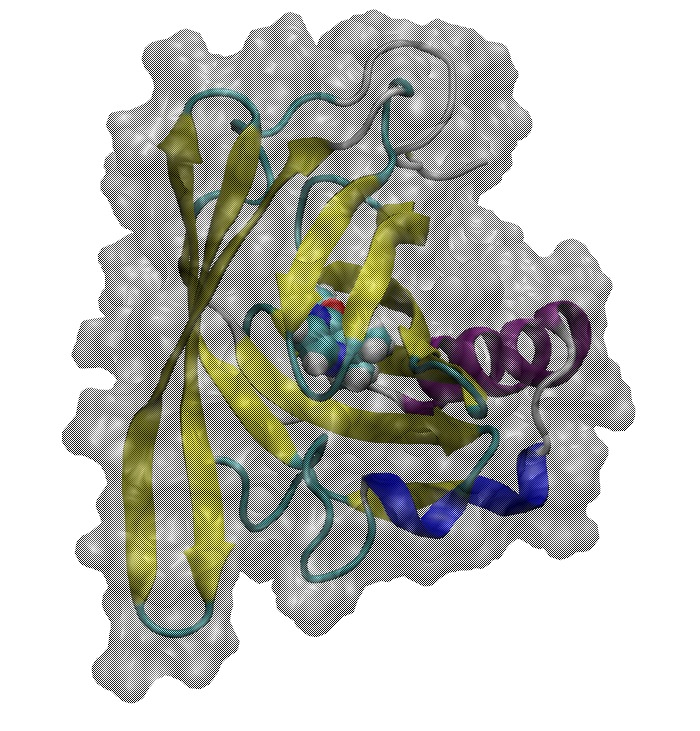
FIG. 1:Ligand binding structure of MUP
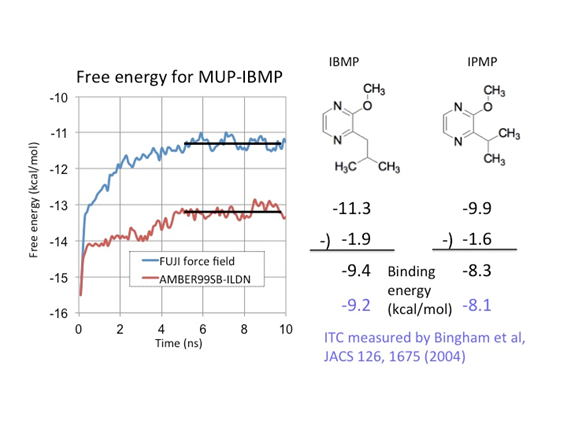
FIG. 2:Convergence of free energy of the complex system of MUP and IBMP and calculated binding free energies in comparison with ITC measurement
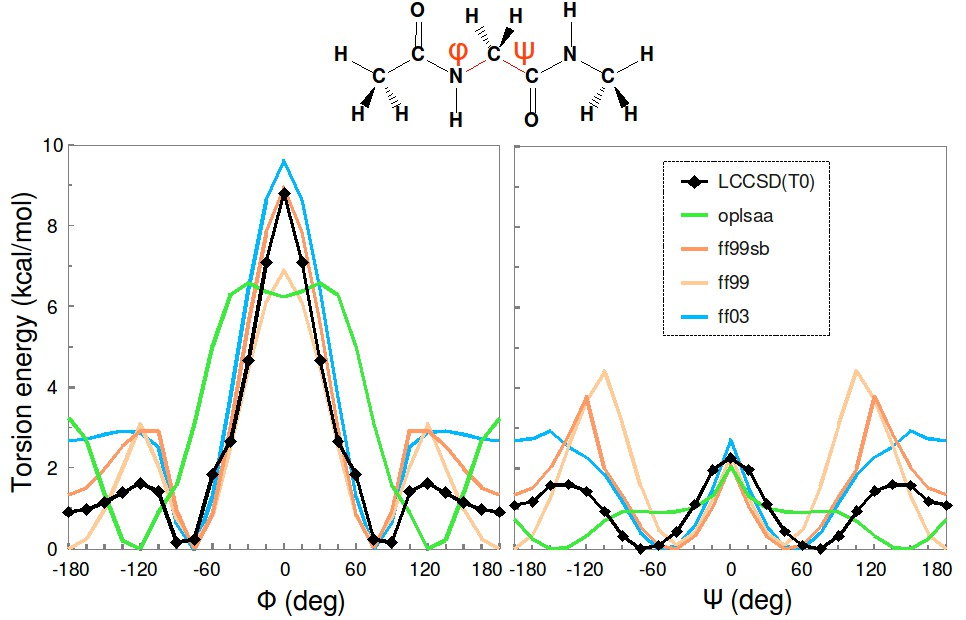
FIG. 3:Torsion energy profiles of Ramachandran angles φ and ψ calculated for glycine dipeptide
Hierarchical integrated simulation for predictive medicine (Theme 3, Shu Takagi, GL)
1)Modeling of the activation of platelets and the efficacy of anti-platelet drug toward the numerical simulations of myocardial infarction.
Last year, we started the modeling of Clopidogrel(CLO). In 2012, we extended this model to simulate more complicated process. Fig.1 illustrates the current model to investigate the effect of ADP feedback mechanism
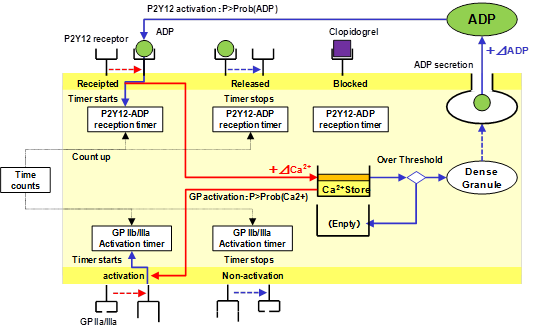
Fig. 1 Platelet model activated by ADP using the simplified activation signaling
Using this model, we have investigated the effect of platelets distribution patterns. Fig. 2 shows the different patterns of platelets distribution: PT1 – PT4, which have been used in the simulation. The different patterns indicate the different effects of surrounding platelets. Corresponding numerical results are shown in Fig.3. In the figure, different lines correspond to the different initial conditions of ADP concentration. It clearly indicates that there is a threshold whether the activation of GPIIb/IIIa last or not. In all cases shown in Fgi.3, the black line (ADP_ini=1.0) and the green line (ADP_ini=0.5) continue increasing. On the other hand, the violet line (ADP_ini=0.1) and the blue line (ADP_ini=0.3) start decaying beyond certain time steps. And, the behavior of red line (ADP_ini=0.4) indicates that depending on the location of platelets distribution, it might show gradual increase or decrease, which reflects the importance of the ADP release from other platelets. These numerical examples indicate that the location of other platelets might be important for the activation of the platelets, but it can be also said that there is not so much drastic effects from surrounding platelets and that the threshold value for the growing is slightly influenced by the location of other platelets. More simulations including the red blood cells need to be done in 2013.
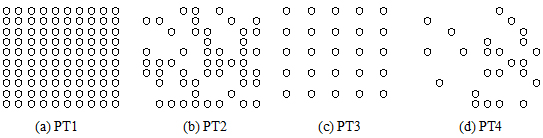
Fig. 2 Different patterns of platelets distribution for the simulations
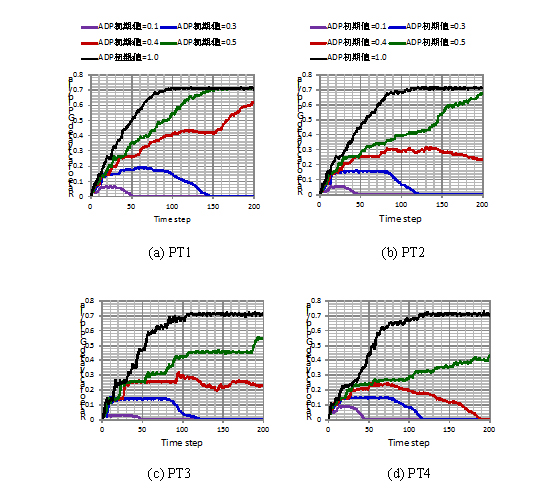
Fig. 3 Numerical results of activation rate on the different patterns of platelets distribution.
Toward the simulation using the actual vessel image data, we have developed the software for the non-straight vessel walls. As an example, we prepare the vessel shape with a bump, which corresponds to the arteriosclerosis part where the von Willbrand Factors are immersed. We have conducted the simulations using three types of vessel walls which have a different stenosis rate as shown in Fig. 4. In these simulations, we have used the platelets model that the adhesion of the platelet is given by the total summation of the binding force through the GP1ba protein and vWF protein interactions. This protein-protein interactions are stochastically solved using the Monte-Carlo simulations and the fluid mechanical simulations using finite difference method are coupled. From the figure, it is shown that the larger bump gives more adhesion of the platelets and the adhesion region of the platelets becomes more widely spreads.
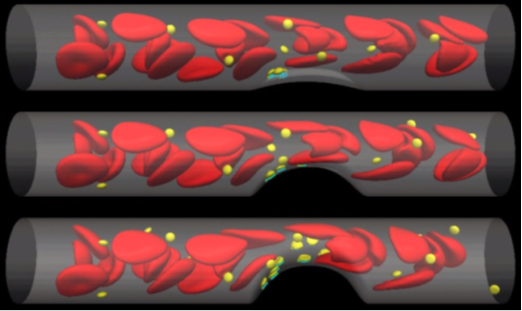
Fig.4 Simulation of platelets adhesion for different stenosis rate
2)Hierarchical modeling of motor dysfunction due to the neurological disorder: Modeling of Parkinson Disease,
We have developed the simulator for spinal cord networks based on a conductance-based model. In this model, membrane potentials of neurons are directly calculated in the simulator which is not the same as that of macroscopic model developed in the last year. This approach has advantages in integrating brain simulator (NEST) and the spinal cord simulator into the integrated simulator. This model has also advantages in coupling with 3D musculoskeletal simulator because the activities of each motoneuron which makes muscle fibers contract can be analyzed in the model. The modeling for muscle and skeleton of human sura region had been conducted and the model successfully reproduced the motion of ankle in the last year. In this year we have improved the modeling of ankle motion of a human and integrated the spinal cord simulator and musculoskeletal simulator together. This report summarizes our activities in this year.
Development of spinal cord simulator
Outline of currently-developed simulator is illustrated in Fig. 5. The spinal cord model consists of alpha motoneuron (denoted by M in Fig. 5), static gamma motoneuron (S), dynamic gamma motoneuron (D), Iα Iinterneuron (I), Ib interneuron (X), and Renshaw cell (R). Alpha motoneuron directly controls muscle fiber contraction by the motor command from brain. Static gamma motoneuron and dynamic gamma motoneuron modulate muscle spindle, one of the feedback sensory organs in a muscle. Iα interneuron and Ib interneuron receive spike trains from muscle spindles and Golgi tendon organ, respectively. These interneurons play an important role in modulating alpha neuron activities depending on sensory feedback. Renshaw cell sends signals to many motoneurons and has an important role in coordination of muscles. In the present simulator of spinal cord networks, we employ conductance-based neuron models based on anatomical knowledge. As an example of governing equations, mathematical expressions for one alpha motoneuron are written in Eqs. (1) – (4).(1)
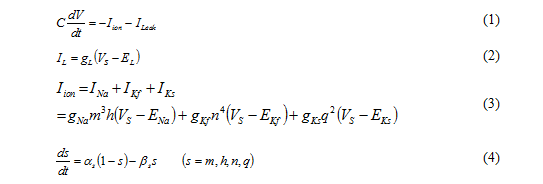
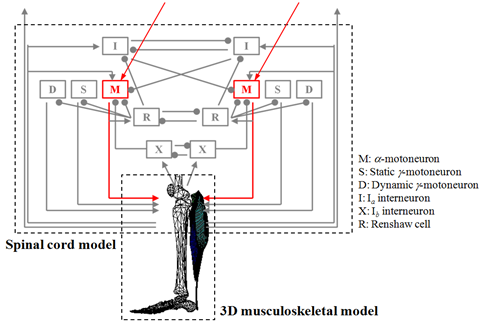
Fig. 5: Overview of spinal cord and musculoskeletal model
Fig. 6: Time course of membrane potentials of alpha motoneurons
A membrane potential of a neuron is expressed by five simultaneous ordinary differential equations, and differential equations for all neurons in the spinal cord simulator need to be calculated simultaneously. The number of neurons in spinal cord for one muscle reaches approximately three thousand.
Firstly, we had developed the simulation cord for alpha motoneurons. Alpha motoneuron directly controls muscle fiber contraction, and the behavior of alpha motoneuron pool (grouping of alpha motoneurons) has two mechanisms of modulating exerted muscle force based on the “size principle”. These two mechanisms are called as “rate coding” and “recruitment”. Figure 6 shows time course of membrane potentials of alpha motoneurons when the direct current is applied. The present model has 900 alpha motoneurons, which is decided from the anatomical data for human soleus. In the figure three motoneurons with the smallest, middle and the largest size are picked up and the reactions for the change of applied current are illustrated. It is shown that only the smallest motoneuron is activated by the small applied current and such a small applied current cannot activate the middle and the largest motoneurons. The larger current is applied, the larger motoneurons become activated. Moreover interspike interval of small motoneurons which has small rheobase current becomes shorter. The exerted force evaluated from the activities of alpha motoneurons as is shown in Fig. 6 are illustrated in Fig. 7. When the applied current is small, the exerted force is weak and it takes longer time to reach the force. On the contrary, the larger current is applied, the stronger force is exerted and the shorter time is required to generate the force. These results prove that the present simulator reproduces important two mechanisms (rate coding and recruitment) to modulate the muscle force.
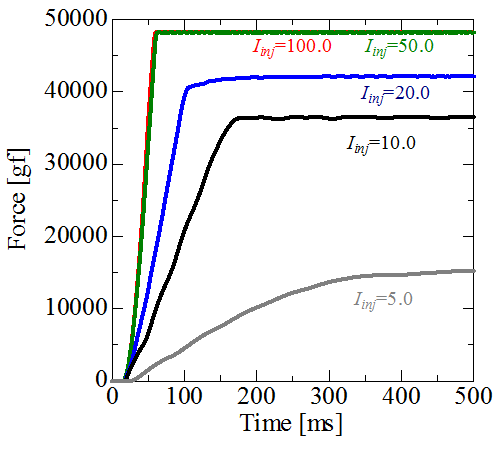
Fig. 7: Time courses of exerted muscle force.
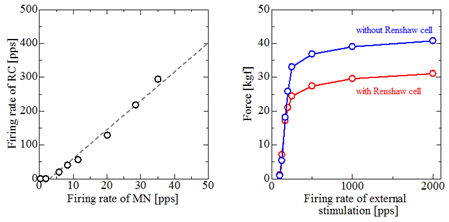
Fig. 8: left:Relation of firing rate between alpha motoneurons and Renshaw cells. right: Inhibitory effect of Renshaw cell on exerted force (recurrent inhibition).
The numerical model of a whole spinal cord network is developed by applying the similar mathematical modeling as alpha motoneuron to other kinds of neurons. For an example, results about recurrent inhibition are shown in Fig. 8. Recurrent inhibition is inhibitory effect by Renshaw cells on alpha motoneuron activities. Model parameters about Renshaw cells and synaptic connections between alpha motoneurons and Renshaw cells are decided from anatomical observations. (2,3,4,5).It is confirmed that the developed simulator reproduces the well-known linear relationship of the firing rates between alpha motoneurons and Renshaw cells. The inhibitory effect of Renshaw cells decreases muscle force by about 25 %.
References
- Cisi, R. R. L., Kohn, A. F., Simulation system of spinal cord motor nuclei and associated nerves and muscles, in a Web-based architecture, Journal of Computational Neuroscience, 25(2008), 520-542.
- McCurdy, M. L., Hamm, T. M., Spatial and temporal features of recurrent facilitation among motoneurons innervating synergistic muscle of the cat, Journal of Neurophysiology, 72(1994), 227–234.
- Windhorst, U., On the role of recurrent inhibitory feedback in motor control, Progress in Neurobiology, 49(1996), 517–587.
- Cullheim, S., Kellerth, J. O., Morphological-study of axons and recurrent axon collaterals of cat alpha-motoneurones supplying different functional types of muscle unit. Journal of Physiology, 281(1978), 301–313.
- (5) Sussman, T., Bathe, K.-J., A FE Formulation for Nonlinear Incompressible Elastic and Inelastic Analysis, Computer & Structures, 26(1987), 357-409.
Large-scale analysis of life data (Theme 4, Satoru Miyano, GL)
This group consists of four PI’s (Yutaka Akiyama, Hideo Matsuda, Kiyoshi Asai, Takashi Gojobori) and the research of this group was managed by Satoru Miyano.
Akiyama developed a massively parallel sequence analysis pipeline for next-generation sequencers. A metagenome analysis pipeline GHOST-MP was developed and applied to human oral microbiome metagenome data that consists of 422 samples from 9 oral sites from Human Metagenome Project. GHOST-MP annotates metagenomic data by very sensitive homology search. A new efficient search algorithm based on suffix array was developed for this pipeline. The new algorithm is about 100 times faster than a conventional program BLASTX for homology search. By devising master/worker model and MPI/OpenMP hybrid programming, GHOST-MP processed 572.8M reads/hour on 663,552 CPU cores. The initial goal 500M reads/hour was achieved. By mapping the identified gene products to metabolic pathways, GHOST-MP revealed that the distribution of the relative abundances of the functional components in oral cavity, oral vestibule, and plaque are different (Figure 1). This is a fact which was not reported from the original Human Metagenome Project.
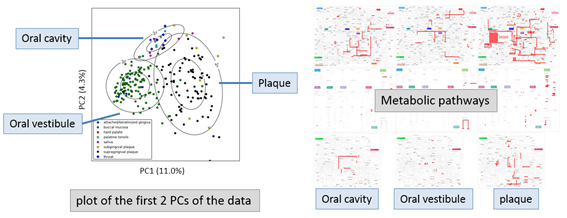
Figure 1: GHOST-MP revealed that the distribution of the relative abundances of the functional components in oral cavity, oral vestibule, and plaque are different.
Matsuda developed a software BENIGN devising large-scale biomolecular network analysis techniques, and applied it to comprehensive analysis of gene networks of adipose tissue responding to cold exposure in collaboration with Professor Teruo Kawada, Graduate School of Agriculture, Kyoto University. Their efforts suggested a new mechanism of thermogenesis in beige adipose tissue. The homo sapiens has two kinds of adipose tissue. One is white adipose tissue whose function is energy storage. The other is brown adipose tissue that appears in a very small amount in adult human but in some amount in baby. Recent studies revealed that BAT is identified in adult humans by PET-CT scans. The function of BAT is heat production and its heat production is 100 times as much as skeletal muscle. It is known that this heat production is activated by UCP1 in mitochondrion. It is considered that the decrease of BAT is one of the reason for obesity. WAT and BAT are in different cell lineages. Recently, the third avatar of adipose tissue was found. That is beige adipose tissue. It is observed that cold exposure causes transdifferentiation from WAT to beige adipose tissue. Kawada produced gene expression profiles of mice after 2, 8 and 16 days from cold exposure (4 degrees Celsius) stimulus and mice without stimulus and gene networks starting from the adipocyte marker genes (Seed Network) were estimated with BENIGN. Network analysis revealed that regulatory edges (activate (red) and inhibit (blue)) around UCP1 (yellow) seem to be very different between brown and beige adipose tissues (Figure 2). This also suggested a possible new pathway to induce UCP1 in beige adipose tissue. Furthermore, the gene network software SiGN was applied to obtain larger gene networks that include about 10,000 up-regulated genes by cold exposure. Comparison also confirmed a new induction mechanism of thermogenesis in beige adipose tissue. By this network analysis, Professor Kawada reached a possible simple working hypothesis for UCP1 induction that shall be biologically validated.
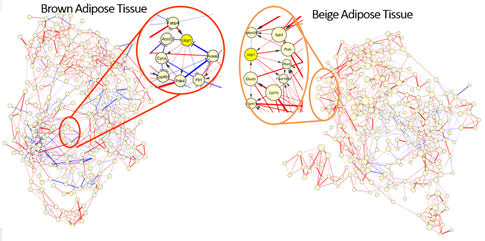
Figure 2: A new pathway to induce UCP1 in Beige adipose tissue is suggested by network analysis.
Asai completed the development of methods for predicting RNA-RNA interaction as a software Ract3D (Figure 3) than can be used for comprehensive analysis of RNA data.
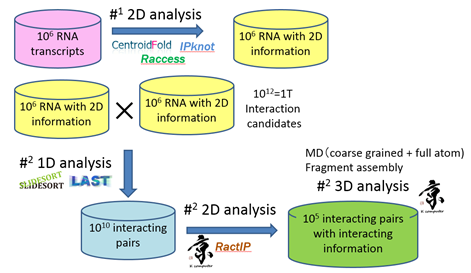
Figure 3: Ract3D: RNA-RNA interaction prediction
Gojobori completed a program RAxML on K computer for inferring phylogenetic trees and analyzed some next-generation sequencer data of lung cancer cells. He obtained an interesting insight on cancer evolution and metastasis (Figure 4).
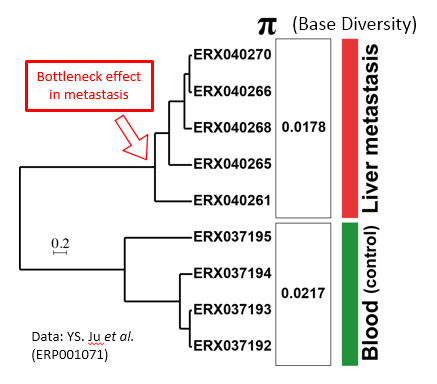
Figure 4: Relationship between base diversity and phylogeny