

We use a supercomputer to analyze cancer genome data for identifying abnormalities of systems in cancer, and finally aim to create prediction methods for drug efficacy and side effects, and novel treatment and prevention methods. Genes form a complex communication network depending on the phosphorylation of proteins they produce, the interaction between proteins, and the control of expression of other genes. This system generates the proteins required to maintain our lives. Meanwhile, cancer is believed to occur due to accumulation of various acquired mutations in genomes.
Such mutations may cause some genes to produce abnormal proteins and then deactivate them, abnormally activate them, or even make them acquire new functions.
Such “failures” of genes affect the network of genes mentioned above. If the system falls into an uncontrollable state, “cancer” is said to have occurred.
Thanks to the breakthrough of the next-generation sequencers, the cost required for determining the entire DNA sequence continues to decrease at a pace faster than Moore’s law. Nowadays, it is as low as 1,000 dollars. This technology also enables measurement of the amount of messenger RNAs produced by each gene. We are now in an age when we can readily obtain individual genome data and genome-related data. Nevertheless, the amount of human genome data or RNA data is overwhelming. The volume of whole genome sequencing data is around 200GB in terms of a contemporary measurement.
Consequently, supercomputing capacity is indispensable for data analysis.
Whereas we simply refer to “cancer” as a type of disorder, it bears diverse genomic variations and mutations. They differ from patient to patient, and even one patient may have multiple cancer-cell populations whose genomes are damaged in different ways. Research activities to understand genomic mutations which determine “cancerous characteristics,” such as high malignancy and drug resistance, are currently in progress.
We successfully established a new data analysis method called “NetworkProfiler” by using statistical theory. This method allows us to find differences in the gene network which determines the characteristics of cancer cells, such as drug resistance, based on data obtained by measuring the amount of RNAs produced by each gene (i.e., RNA expression data). By using this technique, we extracted the gene network relating to the effects of approx. 100 kinds of anticancer drugs based on data for more than 600 cancer cell lines. This was made possible only by using the K computer. Currently, we are engaged in the development of a data analysis technique which can more accurately forecast the effects of anticancer drugs for each cell by combining data from this gene network with a great amount of data on genomic variations from the next-generation sequencer, so as to perform a comprehensive analysis. The results of such an analysis will lead to individualized medical treatments based on the genomic data.
From supercomputing analysis of big cancer genome data to life science and medical care
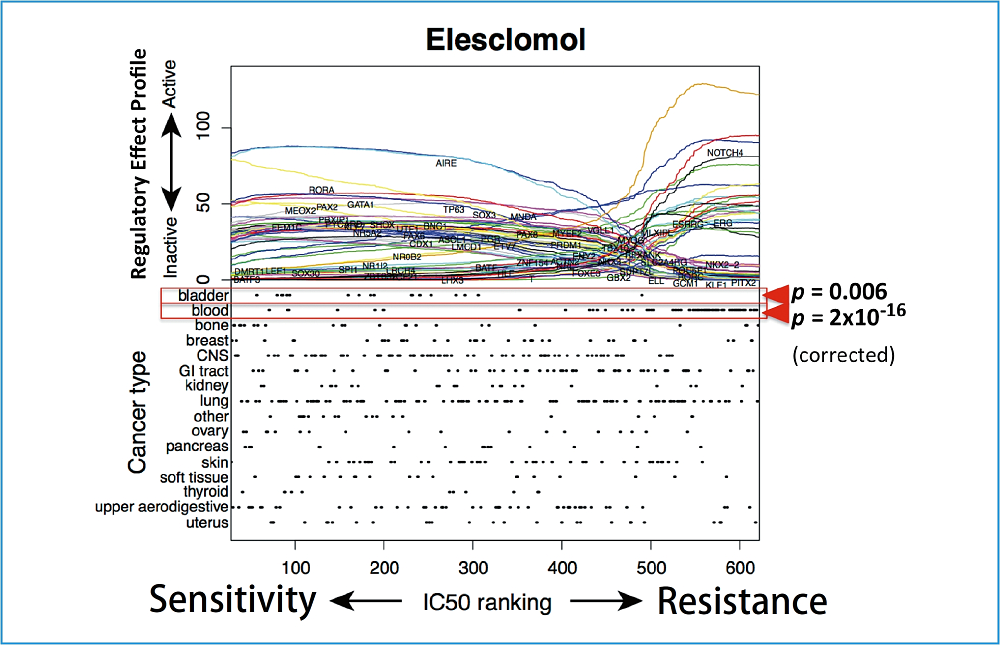
Fig. : Sensitivity to anticancer drug Elesclomol (horizontal axis) and transcription factor activity prediction value (vertical axis of the upper panel).
It shows that, for example, while AIRE controls strongly the controlled genes in cancer cell lines highly sensitive to Elesclomol, its influence is limited in resistant cancer cell lines.
The lower panel shows the biases depending on cancer types. A slight bias toward sensitivity is observed in bladder, while a bias toward resistance is observed in blood. However, no significant biases are observed in other cancer types. The resistance and sensitivity mechanism of Elesclomol is expected to emerge beyond cancer types.
![]()
ZOOM IN Theme 3 Integrated simulations of the nervous system and musculo-skeletal system for reproducing Parkinson’s disease symptoms

 |
 |
 |
 |
 |
|---|